You are here: Hydroland » Projects » Ended projects » GLOBAM
Global Agricultural Monitoring Systems by Integration of Earth Observation and Modelling Techniques (GLOBAM).

Context and objectives
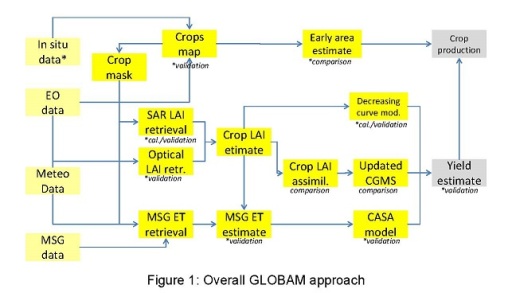
The overall objective of the GLOBAM project was to fill the methodological gap between the state of the art of local crop monitoring and the operational requirement of the global monitoring system, e.g. MARS-STAT/FOOD, FEWS, PECAD programs. The research aimed to develop an integrated approach to combine satellite remote sensing with crop growth modelling by quantitative and physically-based methods. This approach was conceptually different from any other current operational systems such as CGMS, B-CGMS and GMFS. The main research outcomes were methods to estimate crop type area from optical data over large areas and to better monitor the crop development thanks to a quantitative coupling of EO-derived variables and MODIS/MERIS and SAR crop specific LAI, and different crop growth models calibrated to regional conditions. Thanks to the complementarities between the various components and to the recalibration/assimilation techniques involved, this approach, compared to the existing ones, should be more efficient, more general and, last but not least, more robust with regards to exceptional crop growing conditions. The five overarching ideas of this research were (i) to focus mainly on cereals (winter wheat, winter barley, wheat, maize) during the fast growing period of the crop cycle (e.g. 2 to 3 months between tillering and anthesis for wheat) when current EO provides the greatest values (early area estimate and adjustment of the crop growth model), (ii) to deal with wide-scale area issues, i.e. three 300 x 300 km core sites located in Northern Europe, Ethiopia and China, (iii) to be as much as possible sensor independent making use of the best EO effectively available, (iv) to assess the performances of each step in the various contexts to better understand the error sources and, (v) to look for more robust crop production indicators in addition to absolute crop production estimates.
The GLOBAM project has been supported for 4,5 years 7 national and international partners (UCL, ULg, VITO, RMI, CRA-W, Alterra, JRC-Foodsec). The VITO partners were responsible mostly for the remote sensing data acquisition and pre-processing and for the crop type mapping. The UCL-geomatics team developed methods for biophysical crop variables retrieval from optical and SAR remote sensing data. RMI partners estimated crop evapotranspiration from remote sensing and its application in crop growth modelling. The CRA-W, GLOBAM partner thanks to his own initiative, actively contribute to the assimilation of EO-derived data into the crop growth models with our WUR partners. WUR in collaboration with our ULg partners conduced also intensive research on crop growth modelling. Such a complementary partnership not only enhances the scientific research but also the impact of this research project on several operational systems.
Methodology
At least 4 types of satellite data were processed and integrated: the Very Low Resolution (3 to 5 km) MSG land products, the Medium Resolution (1 – 250 m) data to provide daily images and 10-day composite over each site for crop type unmixing and biophysical variables retrieval, the High Resolution with wide swath (30 to 150 m) covering 2 or 3 times the whole site to map the cultivated area and the crop type and the High Resolution (10 to 30 m) to monitor regularly only the calibration area within each site.
We summarize below some of the activities done by RMI in the GLOBAM project.
Originally the LSA SAF ET algorithm (initial version) uses ECOCLIMAP, a monthly land cover and parameters database, to characterize the vegetation. It was decided to modify the ET methodology to assimilate the high-resolution information of crop classification and LAI developed in the framework of the project by VITO and UCL. The classification images of 2007 done by VITO were re-projected to the MSG grid in order to be used by the ET model. The UCL database of the LAI obtained from the pure wheat pixels of MODIS was interpolated and re-projected to the MSG grid to be used by the ET model, to characterize the vegetative wheat behaviour. To validate each modification of the code, the results for the entire 2007 were compared with the values observed at the CarboEurope station of Lonzee. Finally, it was decided to obtain, using the wheat mask from the classification done by VITO and with the LAI behaviour calculated by UCL, images of wheat transpiration, discriminating the contribution of the other land surfaces. In this way, there were obtained values comparable to those used in crop modelling.
MSG land surface temperature and modelled skin temperature were compared with air temperature at the Lonzee CarboEurope and with the ECMWF air temperature data for the coordinates of Lonzee. Results showed the potential of using MSG temperature in crop modelling as air temperature, but due to the good quality of the air temperature values provided by ECMWF and its global covering, it was decided not to dedicate more time to this task and prioritize others more critical for the achievement of the goals of the project.
To evaluate the capabilities of using ET from MSG in the crop growth model CGMS, a first comparison between the 10-days accumulated values for the NEU and ETH sites with the transpiration values of the GMS model was done for 2007. The influence of the LAI values in the ET estimation was studied looking at the ET evolution along the year in Lonzee, using in one hand the averaged ECOCLIMAP LAI and in the other hand, the LAI obtained by UCL from MODIS imagery. Results were compared with the data from the CarboEurope station of Lonzee for 2007.
Results
The implementation of the high-resolution classifications in the evapotranspiration model adds more accurate information to the model, allowing masking a determinate crop and therefore obtaining the transpiration information of this crop separately to the rest of the land surfaces.
The use of high resolution LAI information in the ET model instead ECOCLIMAP LAI improves the ET results especially in the post-harvest period, due to the fact that ECOCLIMAP is a monthly database that aggregates the different crops in four classes.
The results of compare the winter wheat transpiration and potential transpiration maps obtained with those computed internally in the CGMS model showed the potential of assimilate this transpiration images that are obtained from SEVIRI data in the CGMS model.
The obtained results can be used directly in simple crop models like CASA, together with other remote sensing information. A first application of the CASA model using purely SEVIRI products showed promising results. The following steps of this work could be the use of several years of SEVIRI data, first to calibrate the model for the area of interest and second to do a complete validation analysis with the statistical database.
Further details are presented in Sepulcre-Cantó et al. (2013).
Execution
Period: December 2006 – May 2011;
RMI participants: Guadalupe Sepulcre-Cantó (post-doc researcher), Alirio Arboleda and Nicolas Ghilain (scientists, not funded by the project); Françoise Meulenberghs (scientific coordination and administration at RMI).
Partner Institutions: UCL-geomatics (BE, coordination), VITO (BE), ULg (BE), RMI (BE), WAU Alterra (NL), JRC-Foodsec (INT), CRA-W (BE).
Funding source: RMI for internal coordination, administration and systematic participation to the teleconferences and GLOBAM meetings since the start of the project. Belgian Science Policy funds from Stereo 2 programme available from March 2009 until February 2010 (Contract SR/00/101).
References
Defourny-et-al., 2011: Global Agricultural Monitoring Systems by Integration of Earth Observation and Modelling Techniques (GLOBAM project) final report, 264 pp.
Sepulcre-Cantó, G., Gellens-Meulenberghs, F., Arboleda, A., Duveiller, G., Piccard, I., de Wit, A., Tychon, B., Bakary, D. and Defourny P., 2010: Combining Remote Sensing imagery of both fine and coarse spatial resolution to Estimate Crop Evapotranspiration and quantifying its Influence on Crop Growth Monitoring. Talk presented at the EGU assembly, Vienna, 3rd-7th May 2010, summary in Geophysical Research Abstracts (12) EGU2010-10526, 1 pp.
Sepulcre, G., Gellens-Meulenberghs, F., Arboleda, A., Duveiller, G., Piccard, I., de Wit, A., Bakary D., and Defourny, P., 2010: Evapotranspiration assessed by different spatial resolution remote sensing data in a crop monitoring perspective. Poster presented at Recent Advances in Quantitative Remote Sensing (RAQRS) 3 symposium, 27 September-10 October 2010, Torrent, Spain, abstract, 1 pp.
Sepulcre-Cantó, G., Gellens-Meulenberghs, F., Arboleda, A., Duveiller, G., Dewit, A., Eerens, H., Piccard, I., Djabi, B. and Defourny, P., 2013: Estimating crop specific evapotranspiration using remote sensing imagery at various spatial resolutions for improving crop growth modelling. Int. J. Rem. Sens., 34 (9-10), DOI:10.1080/01431161.2012.716911, 3274-3288.